New control: Online Graph
May 17, 2019
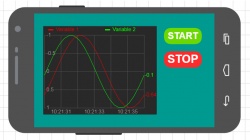
The display element "Online graph" is designed to display changes in variables over time as a graph. Variables are drawn on the graph only when a connection to the device is established, that is online. Up to 10 variables can be displayed on one graph, which will be displayed in different colors in one scale.
The graph is based on the current values transmitted from the controller when the connection is established. Archiving of values is performed on the side of the smartphone. This online graph does not provide any data archive on the controller side. The current values are saved in the archive on the side of the smartphone and further participate in the construction of the graph. The archive on the smartphone also contains data from previous communication sessions with the controller, they are also displayed on the graph.
New features supported by the mobile app version 4.4.1 or up for Android and 1.3.5 or up for iOS.
Tutorial of Online Graph by link.


 Русский