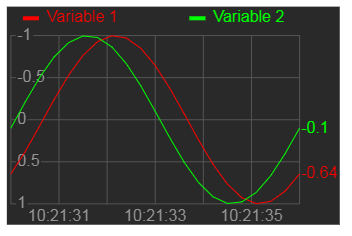
Online grahp

The display element "Online graph" is designed to display changes in variables over time as a graph. Variables are drawn on the graph only when a connection to the device is established, that is online. Up to 10 variables can be displayed on one graph, which will be displayed in different colors in one scale.
Data
| Data | Type |
| Current variable 1 | float |
| Current variable 2 | float |
| ... | float |
| Current variable 10 | float |
Settings
- Variable name - name of the button and the variable in the source code for the microcontroller, allow to set a name for the variable of C rules.
- Show legend - check the box to enable the display of the names of each variable.
- Show values - check the box to enable the display a value of variables to the right on the graph.
- Variables count - set the number of variables that will be displayed in different colors in one scale.
Description
The graph displays the change of variables on the time axis. The graph used floating point numbers.
The graph is based on the current values transmitted from the controller when the connection is established. Archiving of values is performed on the side of the smartphone. This online graph does not provide any data archive on the controller side. The current values are saved in the archive on the side of the smartphone and further participate in the construction of the graph. The archive on the smartphone also contains data from previous communication sessions with the controller, they are also displayed on the graph. You can set the number of days to save historical data for each connected device in the mobile application. The graph allows you to change the scales of the axes and move the axes in both directions.To move the axis, place your finger in the graph field and move it along the axis in the required direction. To change the scale of the axis, place two fingers in the field of the graph and then move the fingers along the required axis to set the required scale. You can select the time axis scale from the menu. Quickly tap your finger in the chart field to open the graph settings. You can set one of the available time axis scales from 15 seconds to 7 days.
You can also enable automatic scaling and move the time axis to the current time using graph settings
If you have significantly changed the configuration of the device interface, then the historical data of previous sessions will be deleted automatically when the connection is established. Significant changes include adding, deleting, replacing controls, changes that affect the list of variables in the RemoteXY structure.
Examples of Arduino IDE
To transfer data to the graph from controller, you need update the values of the corresponding variable in the RemoteXY structure.
The example displays a graph of sine:
RemoteXY.onlineGraph_1_var1 = sin ((float)millis () / 3000.0);
The example displays the voltage value from the analog input A0 of the Arduino controller:
RemoteXY.onlineGraph_1_var1 = float (analogRead(A0)) / 204.8;


 Русский